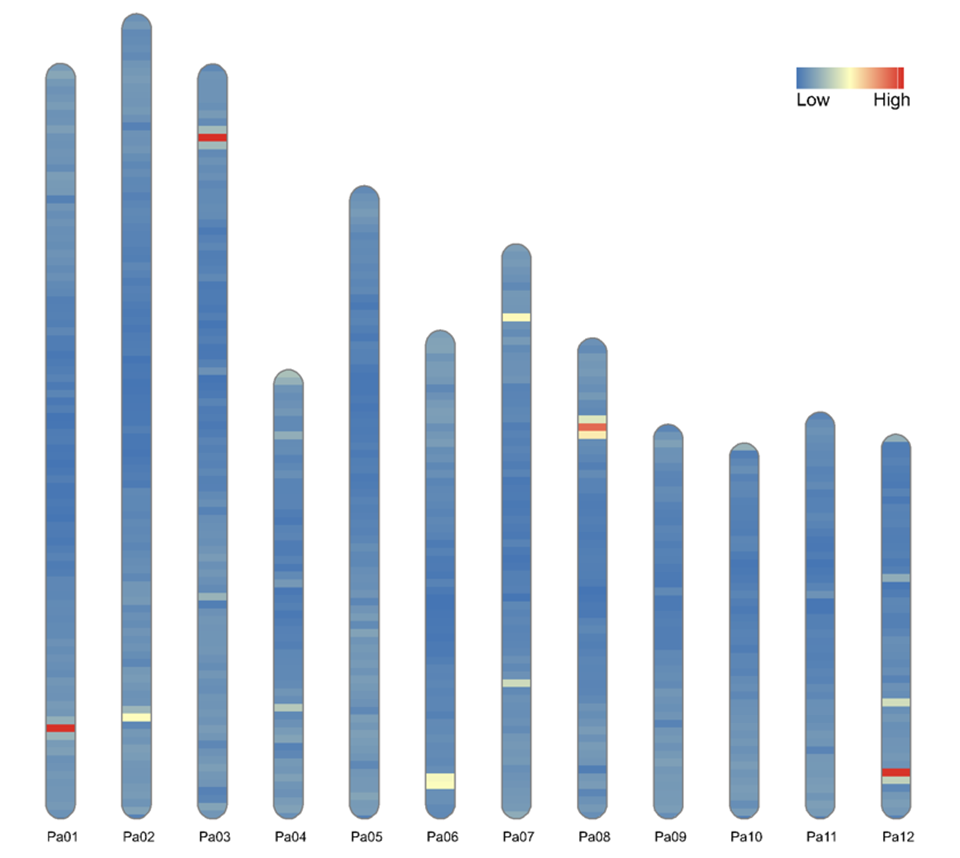
其中主要实现可视化的工具R包是RIdeogram包,文章发布在Hao Z, Lv D, Ge Y, Shi J, Weijers D, Yu G, Chen J. 2020. RIdeogram: drawing SVG graphics to visualize and map genome-wide data on the idiograms. PeerJ Comput. Sci. 6:e251,详细使用说明点这里
但是在使用这个工具之前,需要做一些前期准备工作,在这篇文章里使用了人类的数据作为测试数据。里面需要用到基因组数据(计算染色体长度),基因组注释(计算基因密度)
进行数据的准备工作
首先利用fasta数据计算染色体长度,在这步我使用了一个简单的python脚本:
from Bio import SeqIO

fasta_file = "your_fasta_file.fasta"

chromosome_lengths = {}
for record in SeqIO.parse(fasta_file, "fasta"):
    chromosome_lengths[record.id] = len(record.seq)

for chromosome, length in chromosome_lengths.items():
    print(f"Chromosome {chromosome} length: {length}")
计算后可以得到每条染色体的长度,然后写一个格式如下的文件species_karyotype,第一列是染色体编号,第二列是染色体起点,第三列是终点,第四列和第五列是着丝粒的起始点(没有着丝粒信息就给后两列删除就行,不影响)
#> Chr Start End CE_start CE_end
#> 1 1 0 248956422 122026459 124932724
#> 2 2 0 242193529 92188145 94090557
#> 3 3 0 198295559 90772458 93655574
#> 4 4 0 190214555 49712061 51743951
#> 5 5 0 181538259 46485900 50059807
#> 6 6 0 170805979 58553888 59829934
R包的加载
之后正常装这个R包就行(这个是本地,服务器上拉了R的镜像,但是一直有个相关的依赖包安装不上,问题暂时没解决,解决了再附上)
install.packages("BiocManager")
BiocManager::install('TickingClock1992/RIdeogram')        这步就会报错,需要装remotes包
Error: package 'remotes' not installed in library path(s)
   F:/R/R-4.2.1/library
install with 'BiocManager::install("remotes")'
BiocManager::install("remotes")        这步是否更新时选择no
library(remotes)        看这个包装成功没
BiocManager::install('RIdeogram')        装这个R包即可,这步是否更新时同样选择no
library(RIdeogram)        查看成功没
加载一下这个包里的测试数据看是否成功安装
data(human_karyotype, package="RIdeogram")
data(gene_density, package="RIdeogram")
data(Random_RNAs_500, package="RIdeogram")
接下来计算基因密度:
gene_density <- GFFex(input = "gencode.v32.annotation.gff3.gz", karyotype = "human_karyotype.txt", feature = "gene", window = 1000000)
可以得到下面类似于这个文件species_density,第一列是染色体编号,第二三列是染色体起止点,第四条是基因密度值
#> Chr Start End Value
#> 1 1 1 1000000 65
#> 2 1 1000001 2000000 76
#> 3 1 2000001 3000000 35
#> 4 1 3000001 4000000 30
#> 5 1 4000001 5000000 10
#> 6 1 5000001 6000000 10
最终成图
现在就可以出基础的图了,以下命令可以出染色体和基因密度分布图了
ideogram(karyotype = human_karyotype, overlaid = gene_density)
convertSVG("chromosome.svg", device = "png")
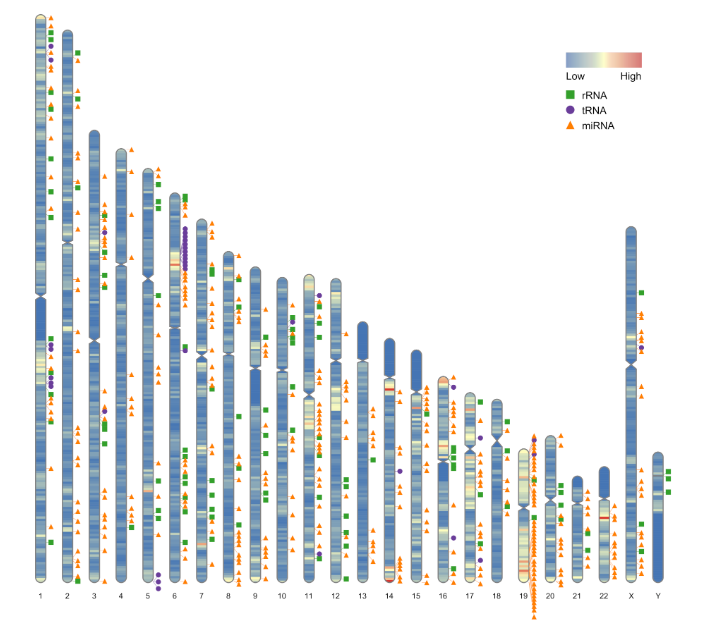
然后准备下列文件Random_RNAs_500,这个就是各类RNA的信息,比如下面的示例文件(tRNA、rRNA、miRNA)
#>    Type    Shape Chr    Start      End  color
#> 1  tRNA   circle   6 69204486 69204568 6a3d9a
#> 2  rRNA      box   3 68882967 68883091 33a02c
#> 3  rRNA      box   5 55777469 55777587 33a02c
#> 4  rRNA      box  21 25202207 25202315 33a02c
#> 5 miRNA triangle   1 86357632 86357687 ff7f00
#> 6 miRNA triangle  11 74399237 74399333 ff7f00
现在可以出各类型RNA分布的情况图了
ideogram(karyotype = human_karyotype, overlaid = gene_density, label = Random_RNAs_500, label_type = "marker")
convertSVG("chromosome.svg", device = "png")
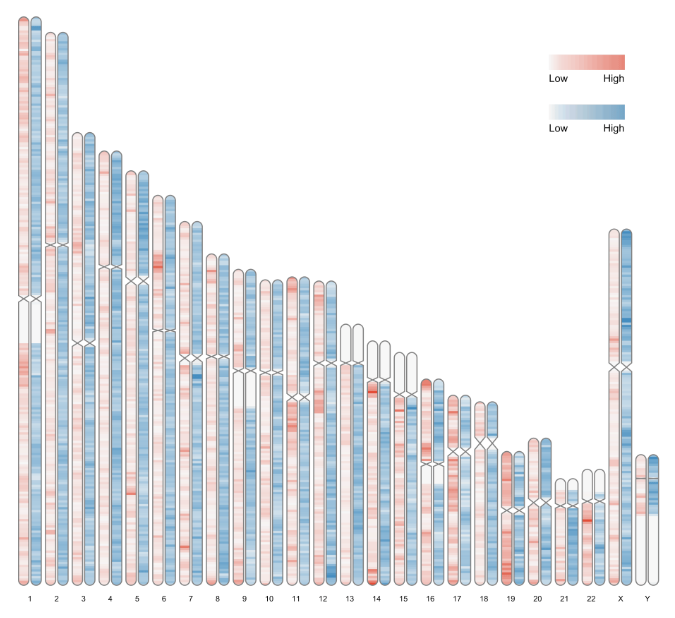
还能以成对染色体形式展示
data(human_karyotype, package="RIdeogram") #reload the karyotype data
ideogram(karyotype = human_karyotype, overlaid = gene_density, label = LTR_density, label_type = "heatmap", colorset1 = c("#f7f7f7", "#e34a33"), colorset2 = c("#f7f7f7", "#2c7fb8")) #use the arguments 'colorset1' and 'colorset2' to set the colors for gene and LTR heatmaps, separately.
convertSVG("chromosome.svg", device = "png")
工具后续还做了共线性分析等功能,是一个可视化程度很高、种类较齐全、美观度很高的很好的工具包