基于PLINK软件的结果文件.eigenval和.eigenvec进行结果可视化
#所用的包
library(data.table)
library(ggplot2)
#读取文件内容
PCA10.re1a=fread("combine_all.pass.recode.13chr.PCA10.eigenval",header=F)
PCA10.re1b=fread("combine_all.pass.recode.13chr.PCA10.eigenvec",header=F)
# 删除前两列样本ID
pca10_data <- PCA10.re1b[,3:ncol(PCA10.re1b)]
# 为列名添加标签,方便后续操作
colnames(pca10_data)<- paste0("PC",1:(ncol(pca10_data)))
#制图并保存
p1 <- ggplot(pca10_data, aes(x = PC1, y = PC2))+ geom_point()+ labs(title ="PCA1 vs PCA2", x ="PCA1", y ="PCA2")+ theme_minimal()
p2 <- ggplot(pca10_data, aes(x = PC1, y = PC3))+ geom_point()+ labs(title ="PCA1 vs PCA3", x ="PCA1", y ="PCA3")+ theme_minimal()
p3 <- ggplot(pca10_data, aes(x = PC2, y = PC3))+ geom_point()+ labs(title ="PCA2 vs PCA3", x ="PCA2", y ="PCA3")+ theme_minimal()
ggsave("PCA1_vs_PCA2.png", plot = p1, width =6, height =4)
ggsave("PCA1_vs_PCA3.png", plot = p2, width =6, height =4)
ggsave("PCA2_vs_PCA3.png", plot = p3, width =6, height =4)
该ggplot()中没有包含具体的信息,因此做出的图效果如下:

ggplot的美化
# 先创建一个空的分类列
pca10_data <- pca10_data[,-11]
pca10_data$Speices <-rep(NA, nrow(pca10_data))
# 对三种杜鹃花进行分类
pca10_data$Speices[1:200]<-"R.agastum"
pca10_data$Speices[201:230]<-"R.delavayi"
pca10_data$Speices[231:260]<-"R.irroratum"
#将 Speices 列转为因子
pca10_data$Speices <- factor(pca10_data$Speices)
# geom_point(size =0.75)可以设置点的大小
# legend.text = element_text(face ="italic")设置图例中的拉丁学名为斜体
p1 <- ggplot(pca10_data, aes(x = PC1, y = PC2, color = Speices))+ geom_point(size =0.75)+ labs(title ="PCA1 vs PCA2", x ="PCA1", y ="PCA2")+ theme_minimal()+ scale_color_manual(values =c("red","blue","green"))+ theme(legend.text = element_text(face ="italic"))
p2 <- ggplot(pca10_data, aes(x = PC1, y = PC3, color = Speices))+ geom_point(size =0.75)+ labs(title ="PCA1 vs PCA3", x ="PCA1", y ="PCA3")+ theme_minimal()+ scale_color_manual(values =c("red","blue","green"))+ theme(legend.text = element_text(face ="italic"))
p3 <- ggplot(pca10_data, aes(x = PC2, y = PC3, color = Speices))+ geom_point(size =0.75)+ labs(title ="PCA2 vs PCA3", x ="PCA2", y ="PCA3")+ theme_minimal()+ scale_color_manual(values =c("red","blue","green"))+ theme(legend.text = element_text(face ="italic"))
保存后的结果如下:

进一步的美化:设置置信圈
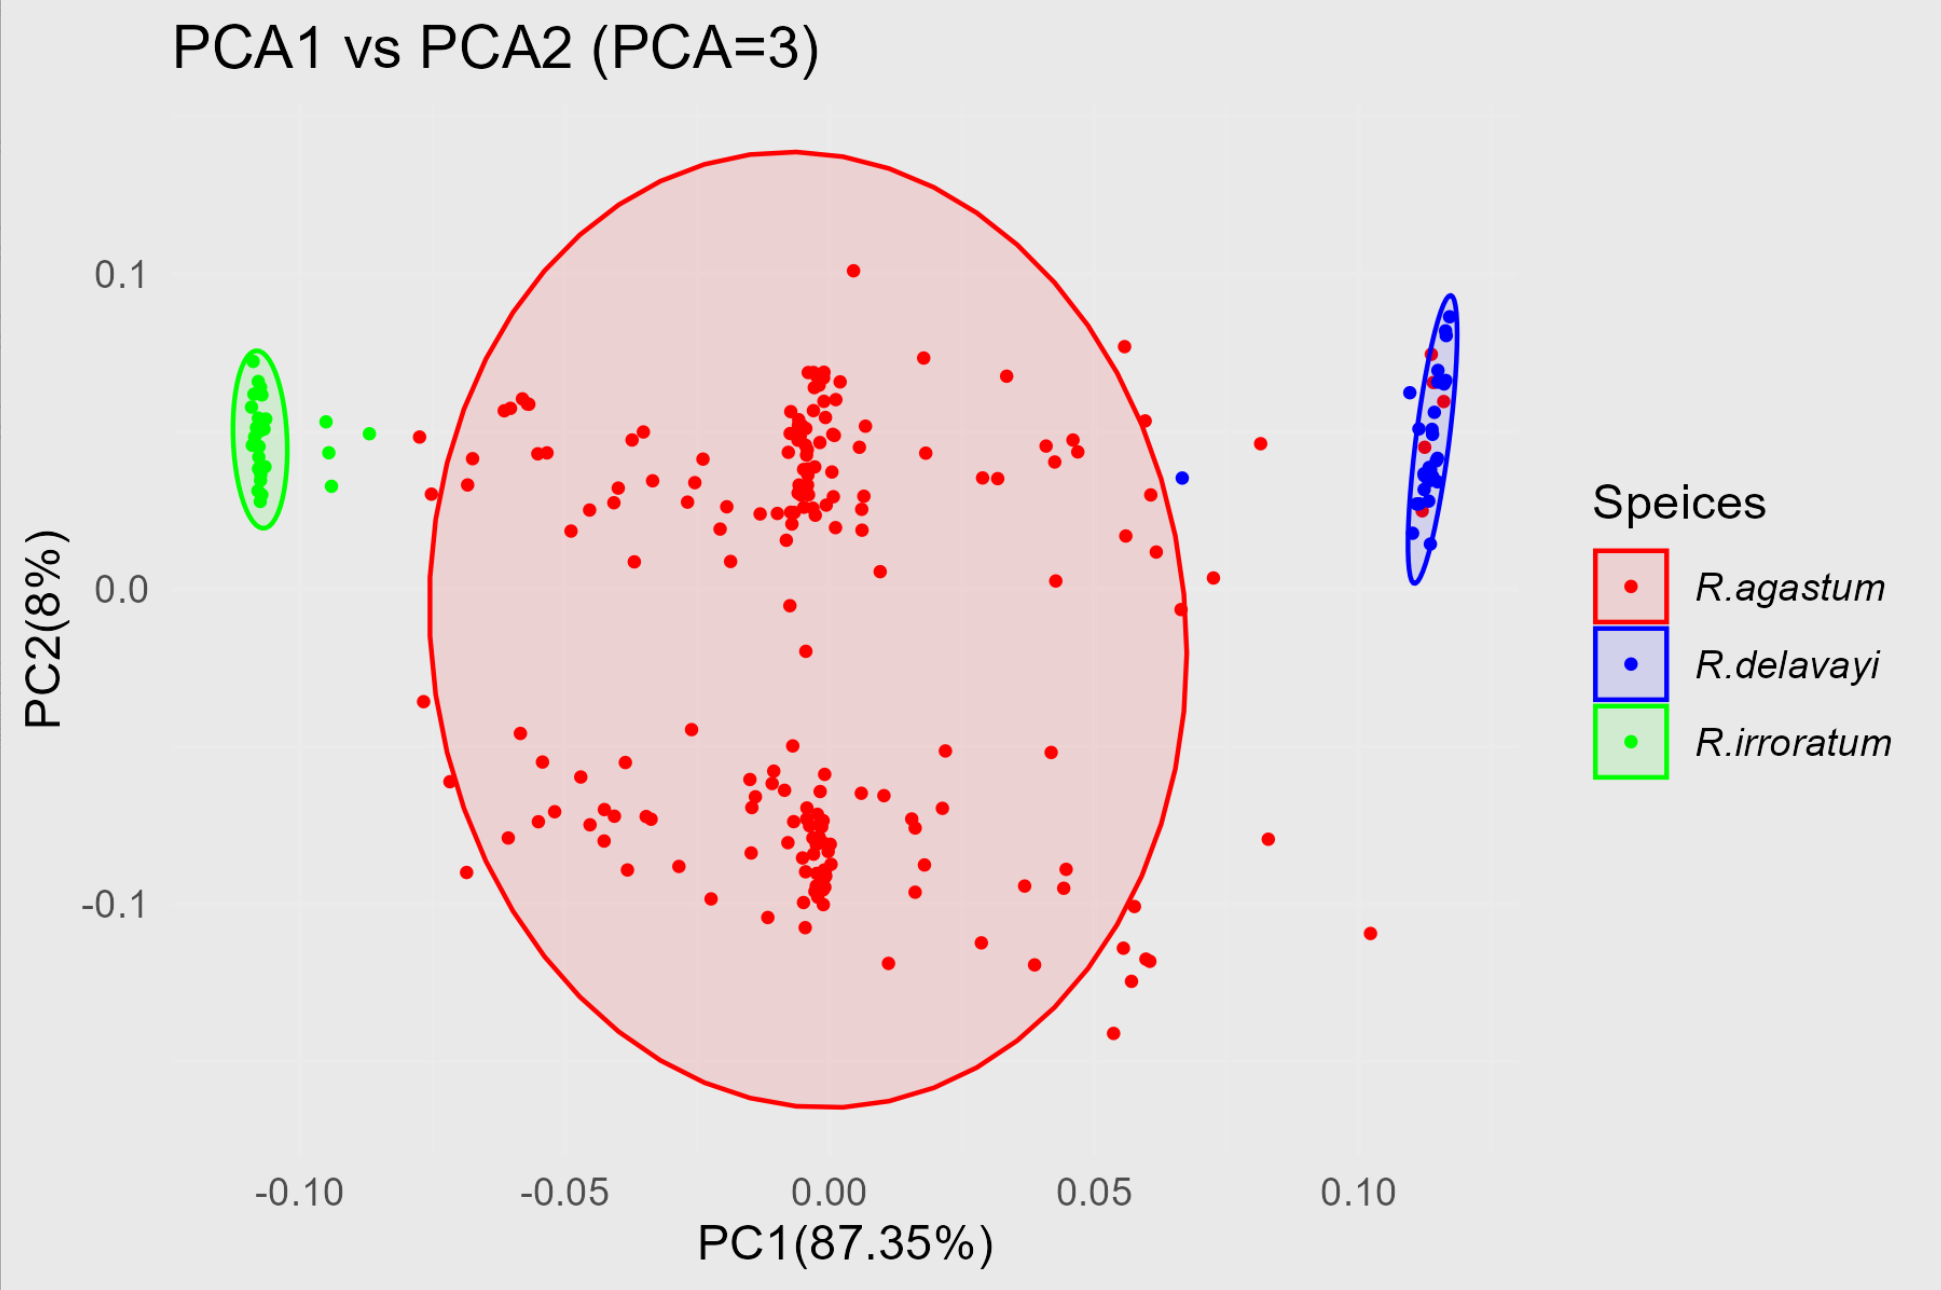
置信圈即显示各组数据的散点分布范围的置信区间椭圆或聚类椭圆,这些椭圆可以帮助直观地了解每一类样本的分布和集中趋势。
p1.10 <- ggplot(pca10_data, aes(x = PC1, y = PC2, color = Speices))+ geom_point(size =0.75)+ stat_ellipse(aes(fill = Speices), geom ="polygon", alpha =0.1)+ labs(title ="PCA1 vs PCA2 (PCA=10)", x =paste0("PC1(",round(PCA10.re1a$por[1],2),"%)"), y =paste0("PC2(",round(PCA10.re1a$por[2],2),"%)"))+ theme_minimal()+ scale_color_manual(values =c("red","blue","green"))+ scale_fill_manual(values =c("red","blue","green"))+ theme(legend.text = element_text(face ="italic"))
p2.10 <- ggplot(pca10_data, aes(x = PC1, y = PC3, color = Speices))+ geom_point(size =0.75)+ stat_ellipse(aes(fill = Speices), geom ="polygon", alpha =0.1)+ labs(title ="PCA1 vs PCA3 (PCA=10)", x =paste0("PC1(",round(PCA10.re1a$por[1],2),"%)"), y =paste0("PC3(",round(PCA10.re1a$por[3],2),"%)"))+ theme_minimal()+ scale_color_manual(values =c("red","blue","green"))+ scale_fill_manual(values =c("red","blue","green"))+ theme(legend.text = element_text(face ="italic"))
p3.10 <- ggplot(pca10_data, aes(x = PC2, y = PC3, color = Speices))+ geom_point(size =0.75)+ stat_ellipse(aes(fill = Speices), geom ="polygon", alpha =0.1)+ labs(title ="PCA2 vs PCA3 (PCA=10)", x =paste0("PC2(",round(PCA10.re1a$por[2],2),"%)"), y =paste0("PC3(",round(PCA10.re1a$por[3],2),"%)"))+ theme_minimal()+ scale_color_manual(values =c("red","blue","green"))+ scale_fill_manual(values =c("red","blue","green"))+ theme(legend.text = element_text(face ="italic"))
#以下两个代码显示具体的贡献度
x =paste0("PC2(",round(PCA3.re1a$por[2],2),"%)")
y =paste0("PC3(",round(PCA3.re1a$por[3],2),"%)"))
#该函数用于以Speices创建三个置信圈,还可以使用 level=NA 参数设置范围,alpha为置信圈内部透明度
stat_ellipse(aes(fill = Speices), geom ="polygon", alpha =0.1)
最终的结果如图:

