表达基因聚类分析
• 进行 Mfuzz 聚类分析(假设已完成表达矩阵标准化)推荐使用 log2(TPM + 1) 或 log2(FPKM + 1) 的表达矩阵。
• 绘制聚类趋势图并保存为 PNG 图片
• 自动导出每一类基因列表到 txt 文件
• 自动统计每一类的基因数目,并保存为表格
根据需求修改输入和输出文件及文件夹位置
使用方法:直接复制粘贴到r中,我是在windows版的r中运行。或者保存为r代码文件,运行这个代码文件。
# 加载必要包
library(Mfuzz)
library(Biobase)
library(pheatmap)
setwd("D:/课题/转录组结果/雌雄干旱/")
# ==== 1. 读取并标准化数据 ====
# 读取表达矩阵(行为基因,列为时间点/处理)
expr <- read.table("D:/课题/转录组结果/雌雄干旱/cxganhanneg_log_filtered_standardized.csv", header=TRUE, row.names=1)
eset <- ExpressionSet(assayData = as.matrix(expr))
eset <- standardise(eset)
# ==== 2. 聚类 ====
m <- mestimate(eset)
cl <- mfuzz(eset, c=6, m=m) # 设置聚类数量c=6,可修改
# ==== 3. 保存聚类趋势图 ====
pdf("r1negmfuzz_clusters.pdf", width = 12, height = 8) # 单位英寸
mfuzz.plot(eset, cl=cl, mfrow=c(3,2), new.window=FALSE)
dev.off()
# ==== 4. 创建输出文件夹 ====
output_dir <- "r1negmfuzz_clusters"
if (!dir.exists(output_dir)) {
dir.create(output_dir, recursive = TRUE)
}
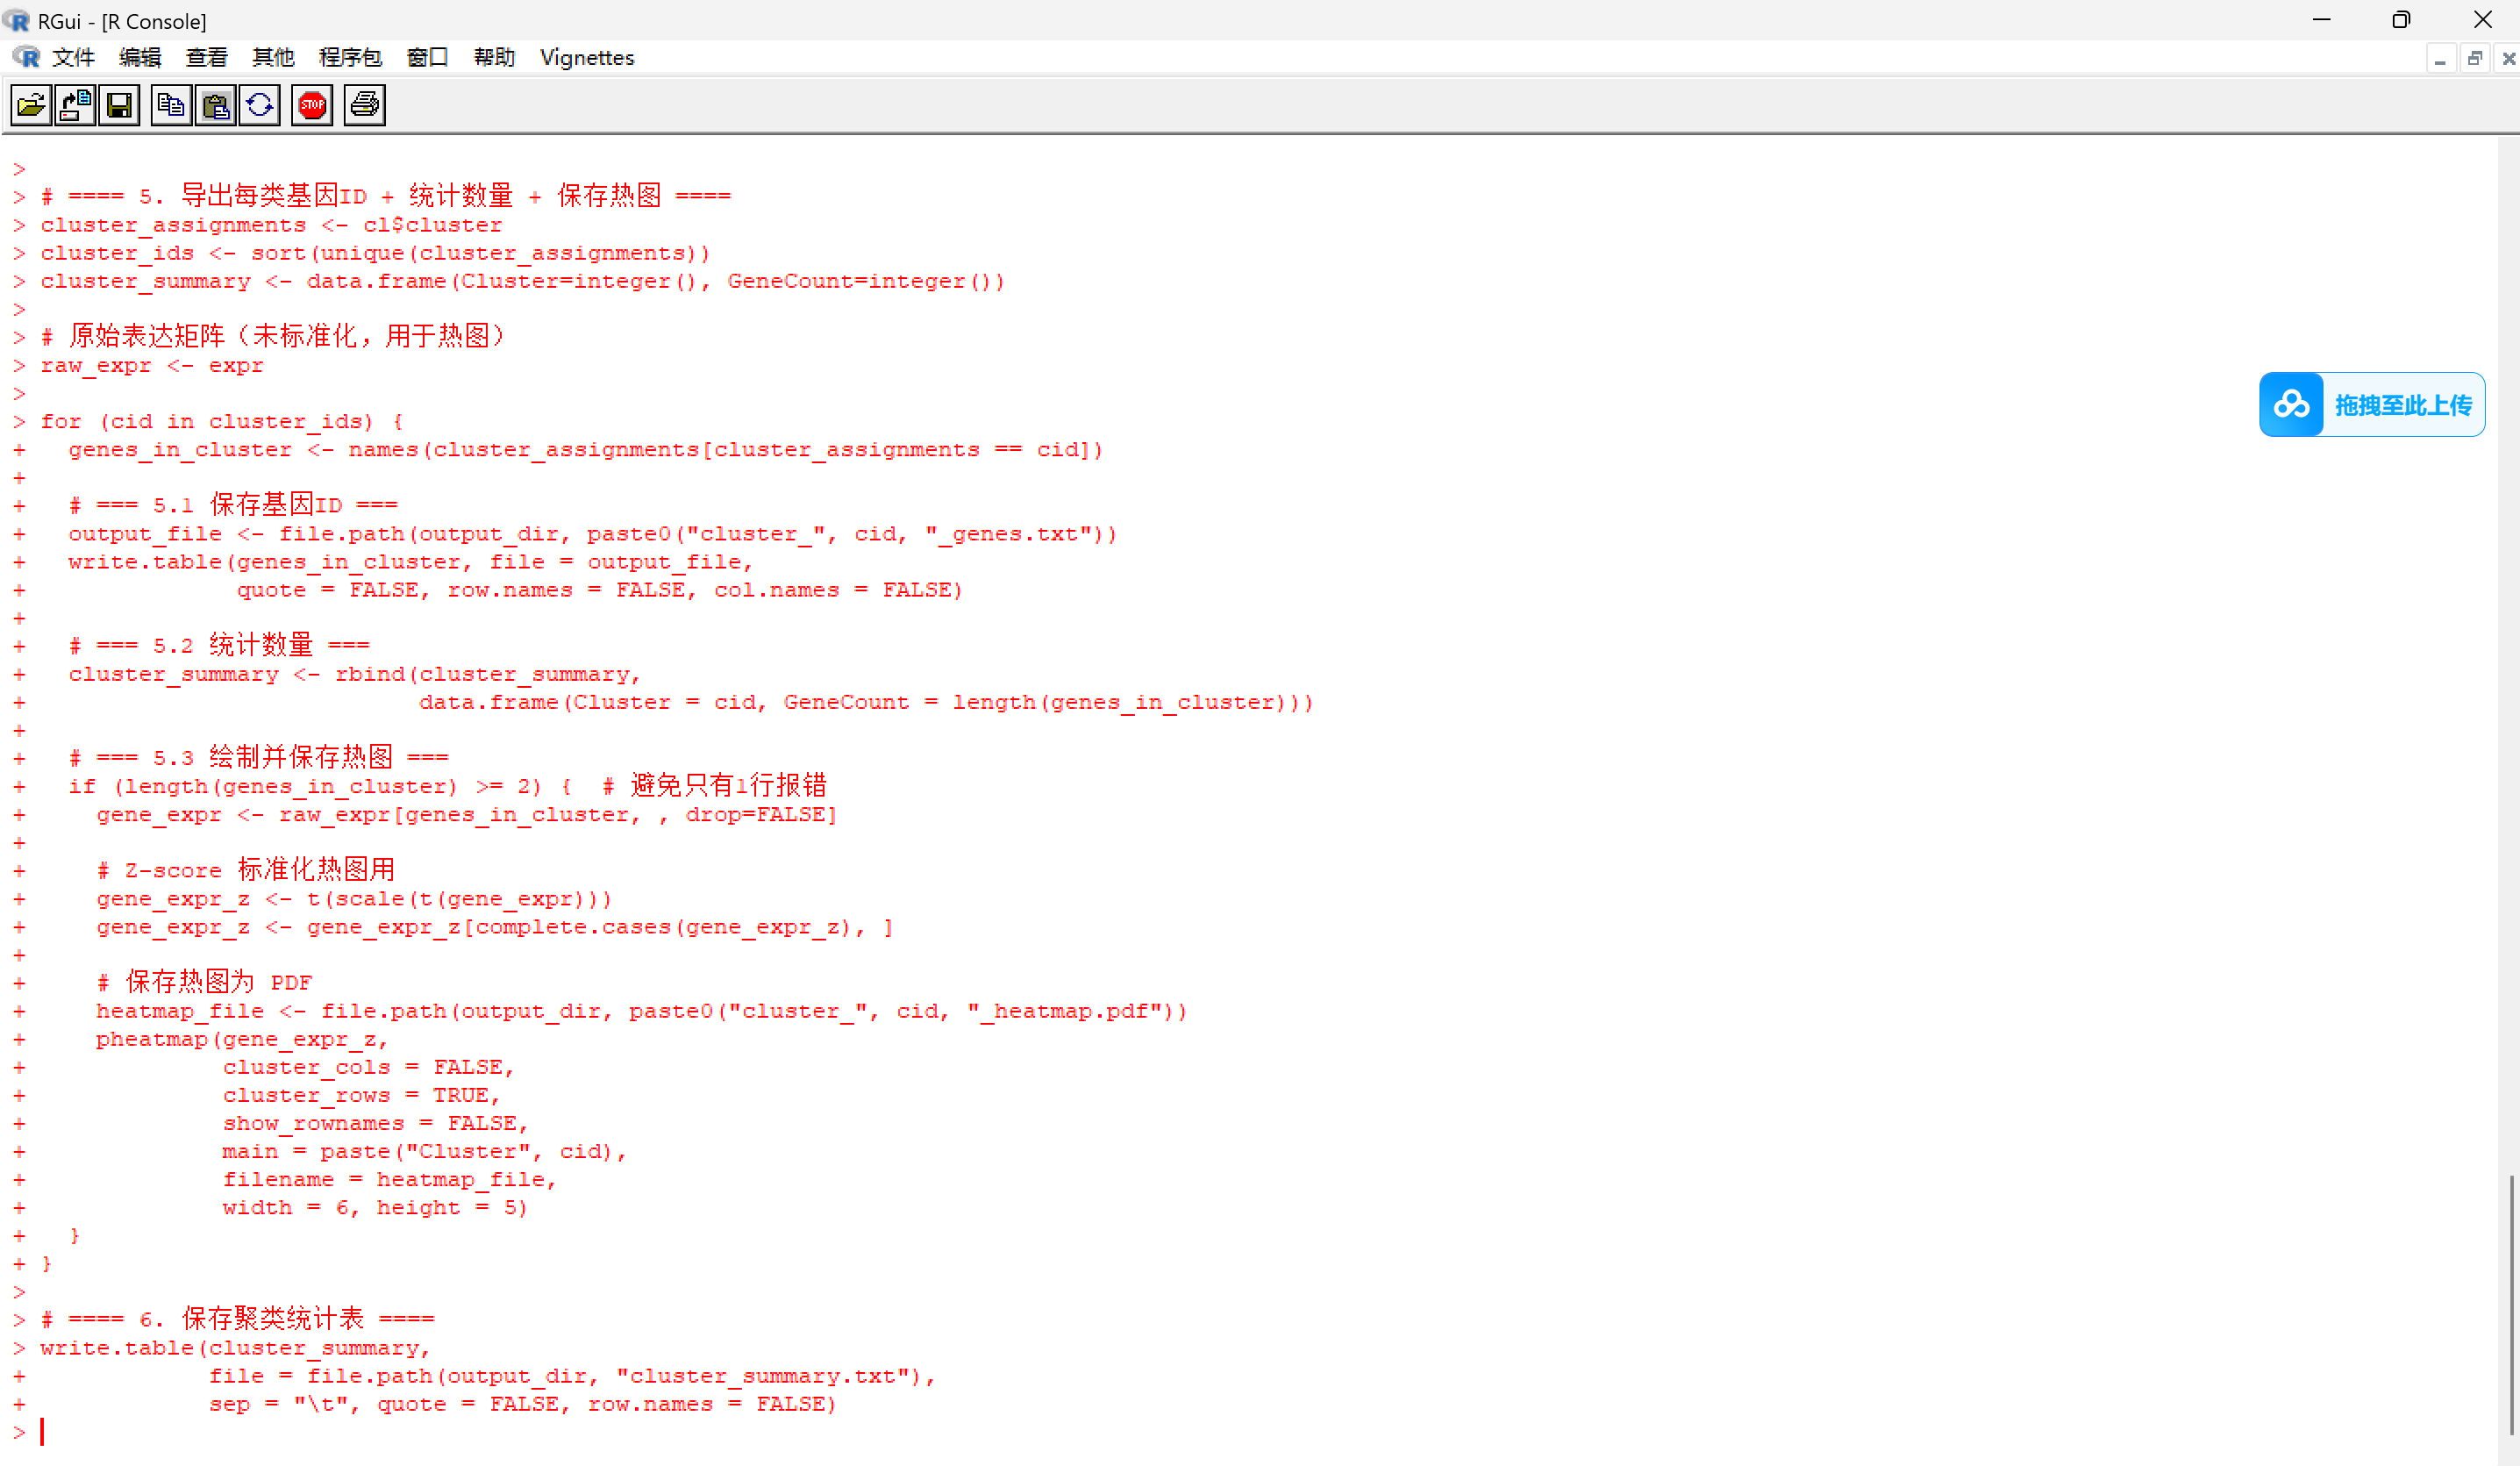
# ==== 5. 导出每类基因ID + 统计数量 + 保存热图 ====
cluster_assignments <- cl$cluster
cluster_ids <- sort(unique(cluster_assignments))
cluster_summary <- data.frame(Cluster=integer(), GeneCount=integer())
# 原始表达矩阵(未标准化,用于热图)
raw_expr <- expr
for (cid in cluster_ids) {
genes_in_cluster <- names(cluster_assignments[cluster_assignments == cid])
# === 5.1 保存基因ID ===
output_file <- file.path(output_dir, paste0("cluster_", cid, "_genes.txt"))
write.table(genes_in_cluster, file = output_file,
quote = FALSE, row.names = FALSE, col.names = FALSE)
# === 5.2 统计数量 ===
cluster_summary <- rbind(cluster_summary,
data.frame(Cluster = cid, GeneCount = length(genes_in_cluster)))
# === 5.3 绘制并保存热图 ===
if (length(genes_in_cluster) >= 2) { # 避免只有1行报错
gene_expr <- raw_expr[genes_in_cluster, , drop=FALSE]
# Z-score 标准化热图用
gene_expr_z <- t(scale(t(gene_expr)))
gene_expr_z <- gene_expr_z[complete.cases(gene_expr_z), ]
# 保存热图为 PDF
heatmap_file <- file.path(output_dir, paste0("cluster_", cid, "_heatmap.pdf"))
pheatmap(gene_expr_z,
cluster_cols = FALSE,
cluster_rows = TRUE,
show_rownames = FALSE,
main = paste("Cluster", cid),
filename = heatmap_file,
width = 6, height = 5)
}
}
# ==== 6. 保存聚类统计表 ====
write.table(cluster_summary,
file = file.path(output_dir, "cluster_summary.txt"),
sep = "\t", quote = FALSE, row.names = FALSE)